This article covers Polish regulations and market practice. The principles apply elsewhere, but check the rules in your country.
In my latest piece I will argue that managing a vehicle fleet is becoming ever more complicated because of rising costs, technological change and the challenges of climate policy.
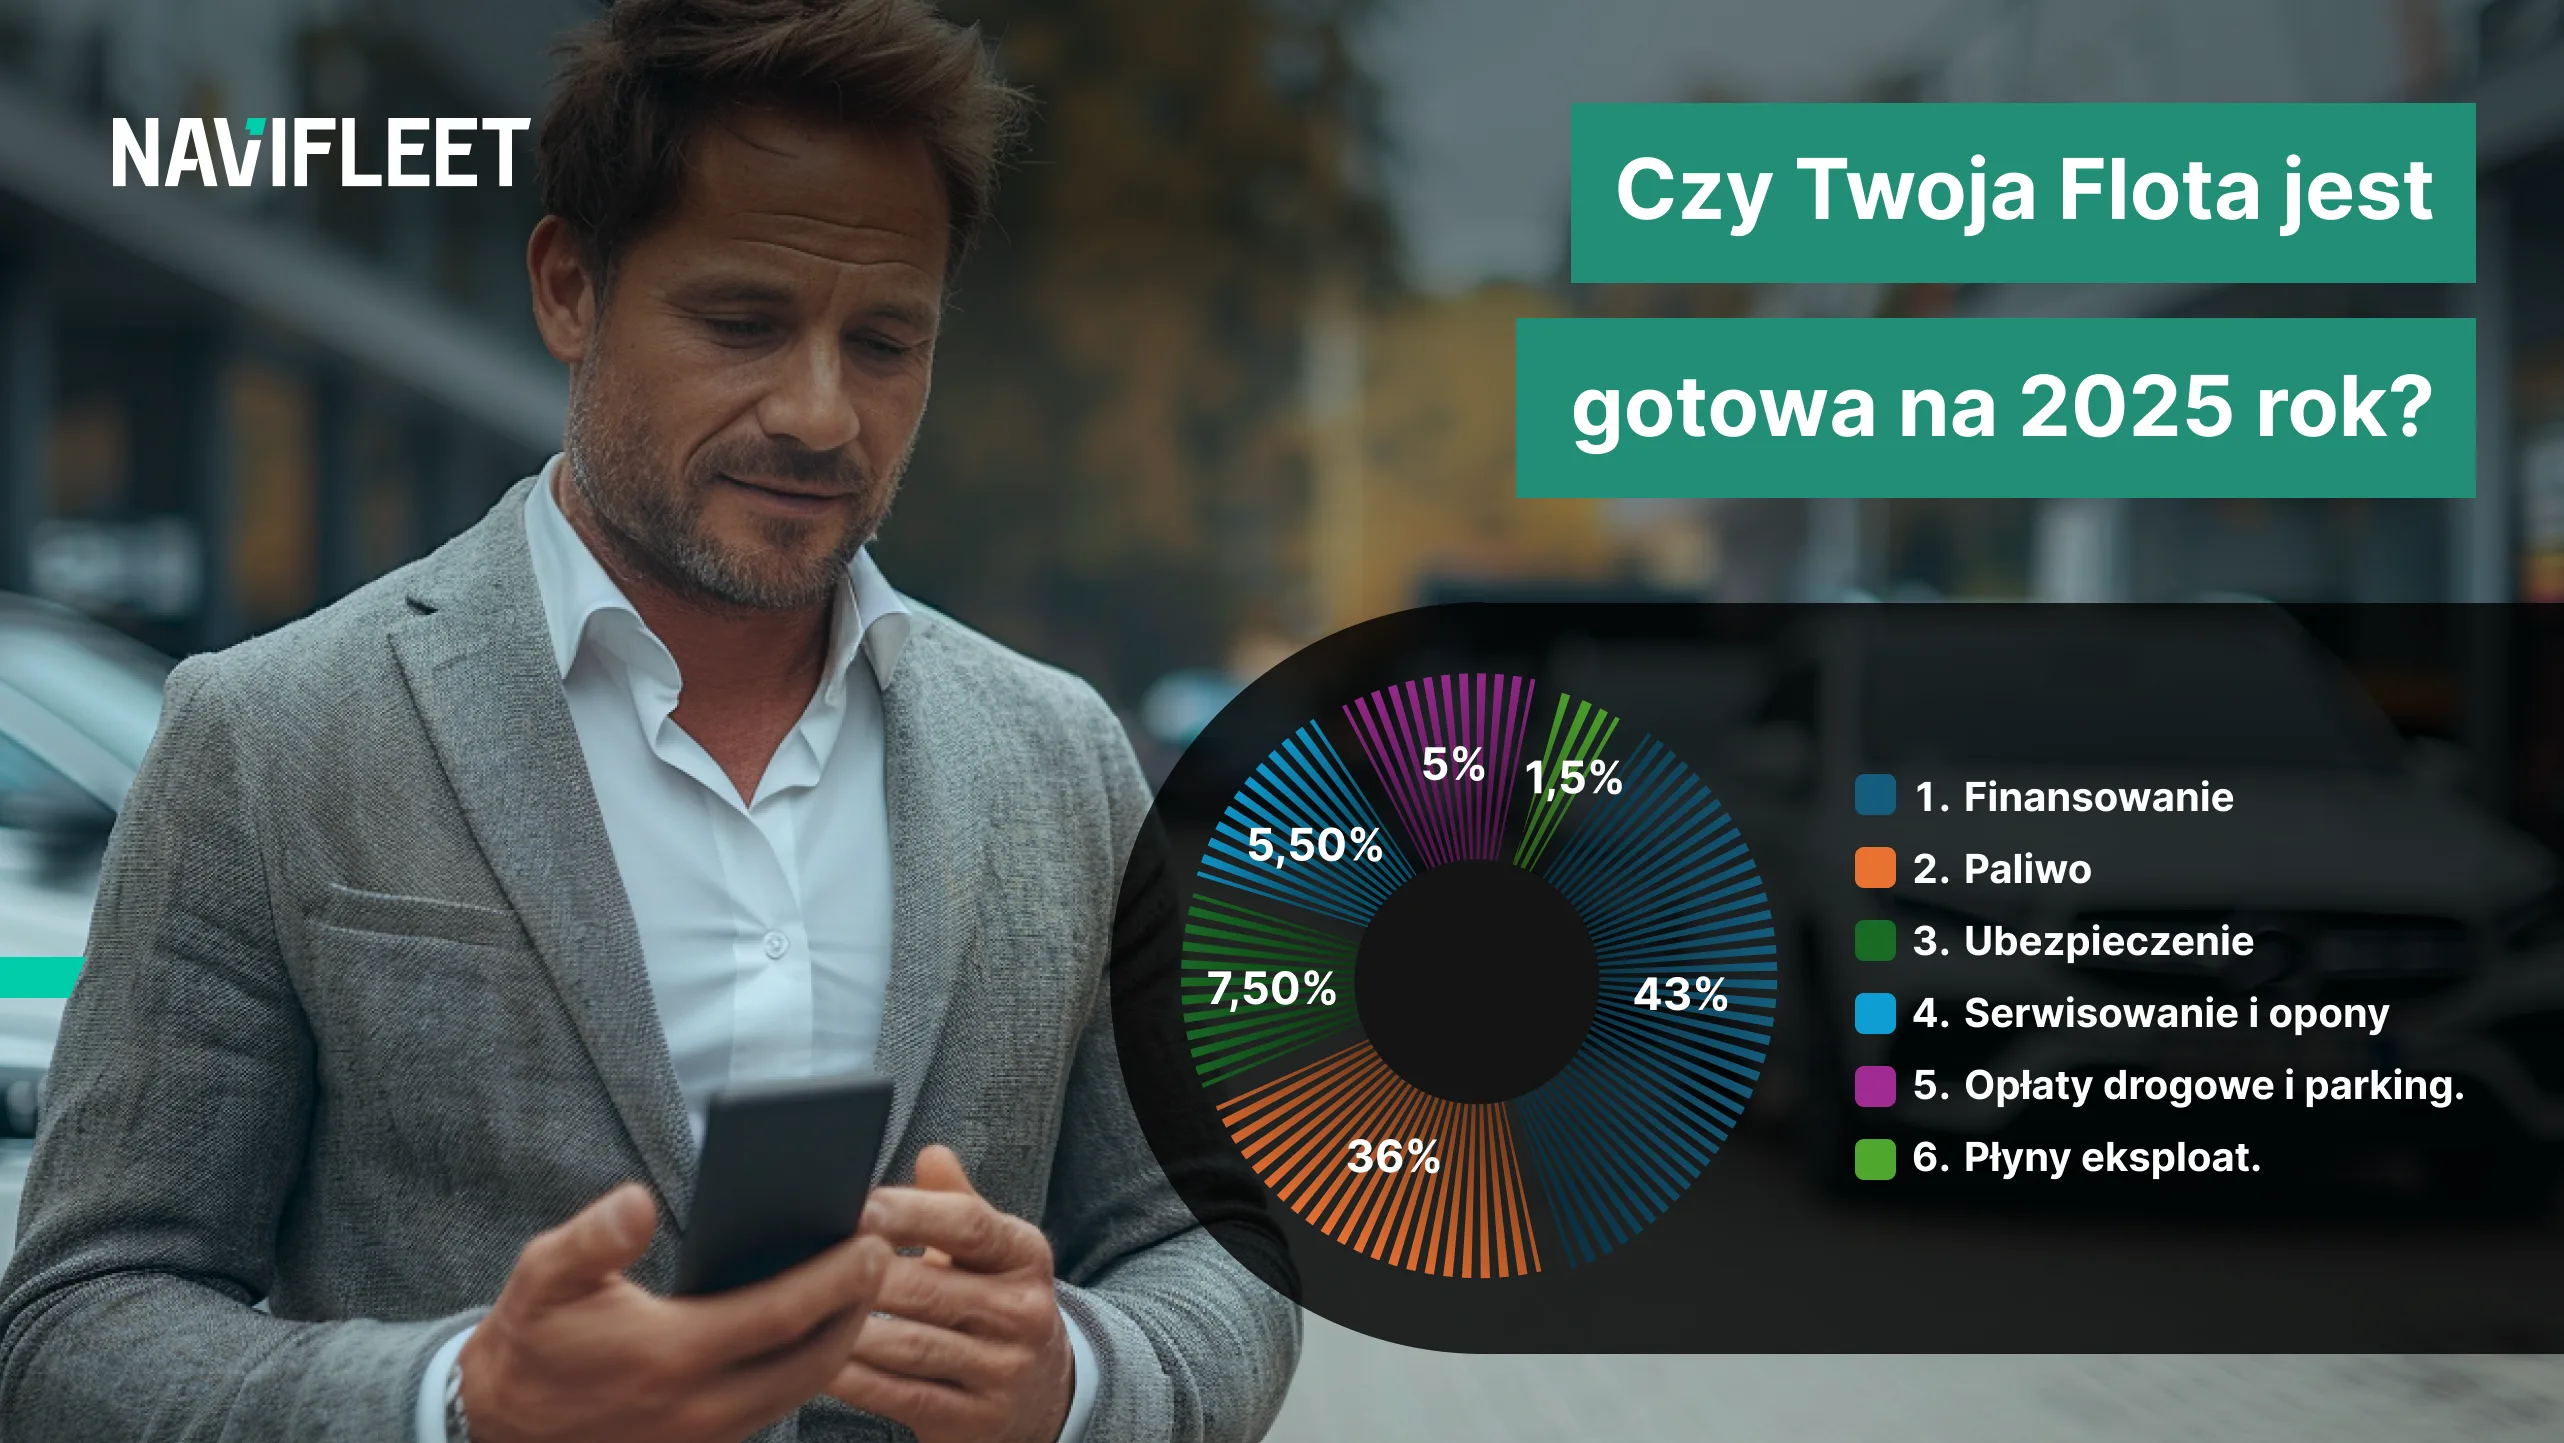
To meet these demands, fleet managers must not only make financial decisions, but also analyse data effectively, monitor costs and optimise processes. Along the way we will look at the key findings of the 2024 Fleet Barometer survey, which shows fleet management trends in Poland, financing methods and the challenges awaiting managers in the coming years. We will also discuss in detail TCO (Total Cost of Ownership) models, the choice of key performance indicators, and techniques for continuous improvement of the fleet management process using the Lean tools I have selected. TTT
Non-obvious findings from the Fleet Barometer survey conducted by one of the largest CFM companies in Poland.
The greatest growth potential for passenger car fleets lies in companies employing 10 to 99 people – over 40% of them say they will acquire additional vehicles in the coming years. Light commercial vehicles, in turn, will be added above all in micro-enterprises (1–9 people) and large companies (100–499 employees) – just over 40% of them want to expand their LCV fleet.
The most important reason for expanding fleets in Poland is still company growth – cited by 83% of respondents. Another very important reason (38%) is HR-related goals, including attracting new talent and retaining the best employees. Almost 30% of respondents in Poland also mention plans to introduce corporate car sharing.
According to this year's survey, 6% of Polish companies have fleets of 1 to 9 vehicles. 44% of companies use 10 to 99 cars. Larger fleets, of 100 to 999 cars, are run by 39% of the businesses surveyed in Poland, while the largest fleets, of more than 1,000 cars, are declared by 12% of respondents.
Preferred methods of financing vehicles vary considerably depending on company size. Purchase from own funds has gained a great deal of popularity among companies with 100 to 499 employees (more than doubling in a year, to 43%). Leasing dominates in medium-sized enterprises – it is chosen by 2 in 5 companies employing 10 to 99 people. Long-term rental is most popular among micro-enterprises (up to 9 employees) – 27% of respondents in this group chose it. Fleet managers were asked about their interest in long-term rental over the next three years.
One in three respondents said they will probably or definitely choose this solution. The greatest chance of growth in the share of rental is seen in the largest enterprises – 37% of companies in this group are considering this form of financing. Respondents from companies employing 10 to 99 people, in turn, are the most certain about introducing rental in their fleet – there, 13% of respondents say they will definitely use this form of financing within three years.
Respondents were also asked about the biggest fleet management challenges over the next three years. In Poland many concerns relate to the energy transition and the broad changes associated with climate policy.
For 17% of respondents the biggest challenge will be introducing alternative drivetrains in their fleets, 13% are concerned about adapting to restrictive policies on combustion-engine vehicles, and one in 10 respondents pointed to adapting the fleet to the growth of low-emission zones in cities. Other key challenges mentioned included limiting the growth of the total cost of ownership of cars (15%) and encouraging employees to drive more responsibly (13%).
Total cost of ownership (TCO)
At this point I would like to draw particular attention to how the method of financing
affects the management over time of the TCO a fleet manager will have to contend with.
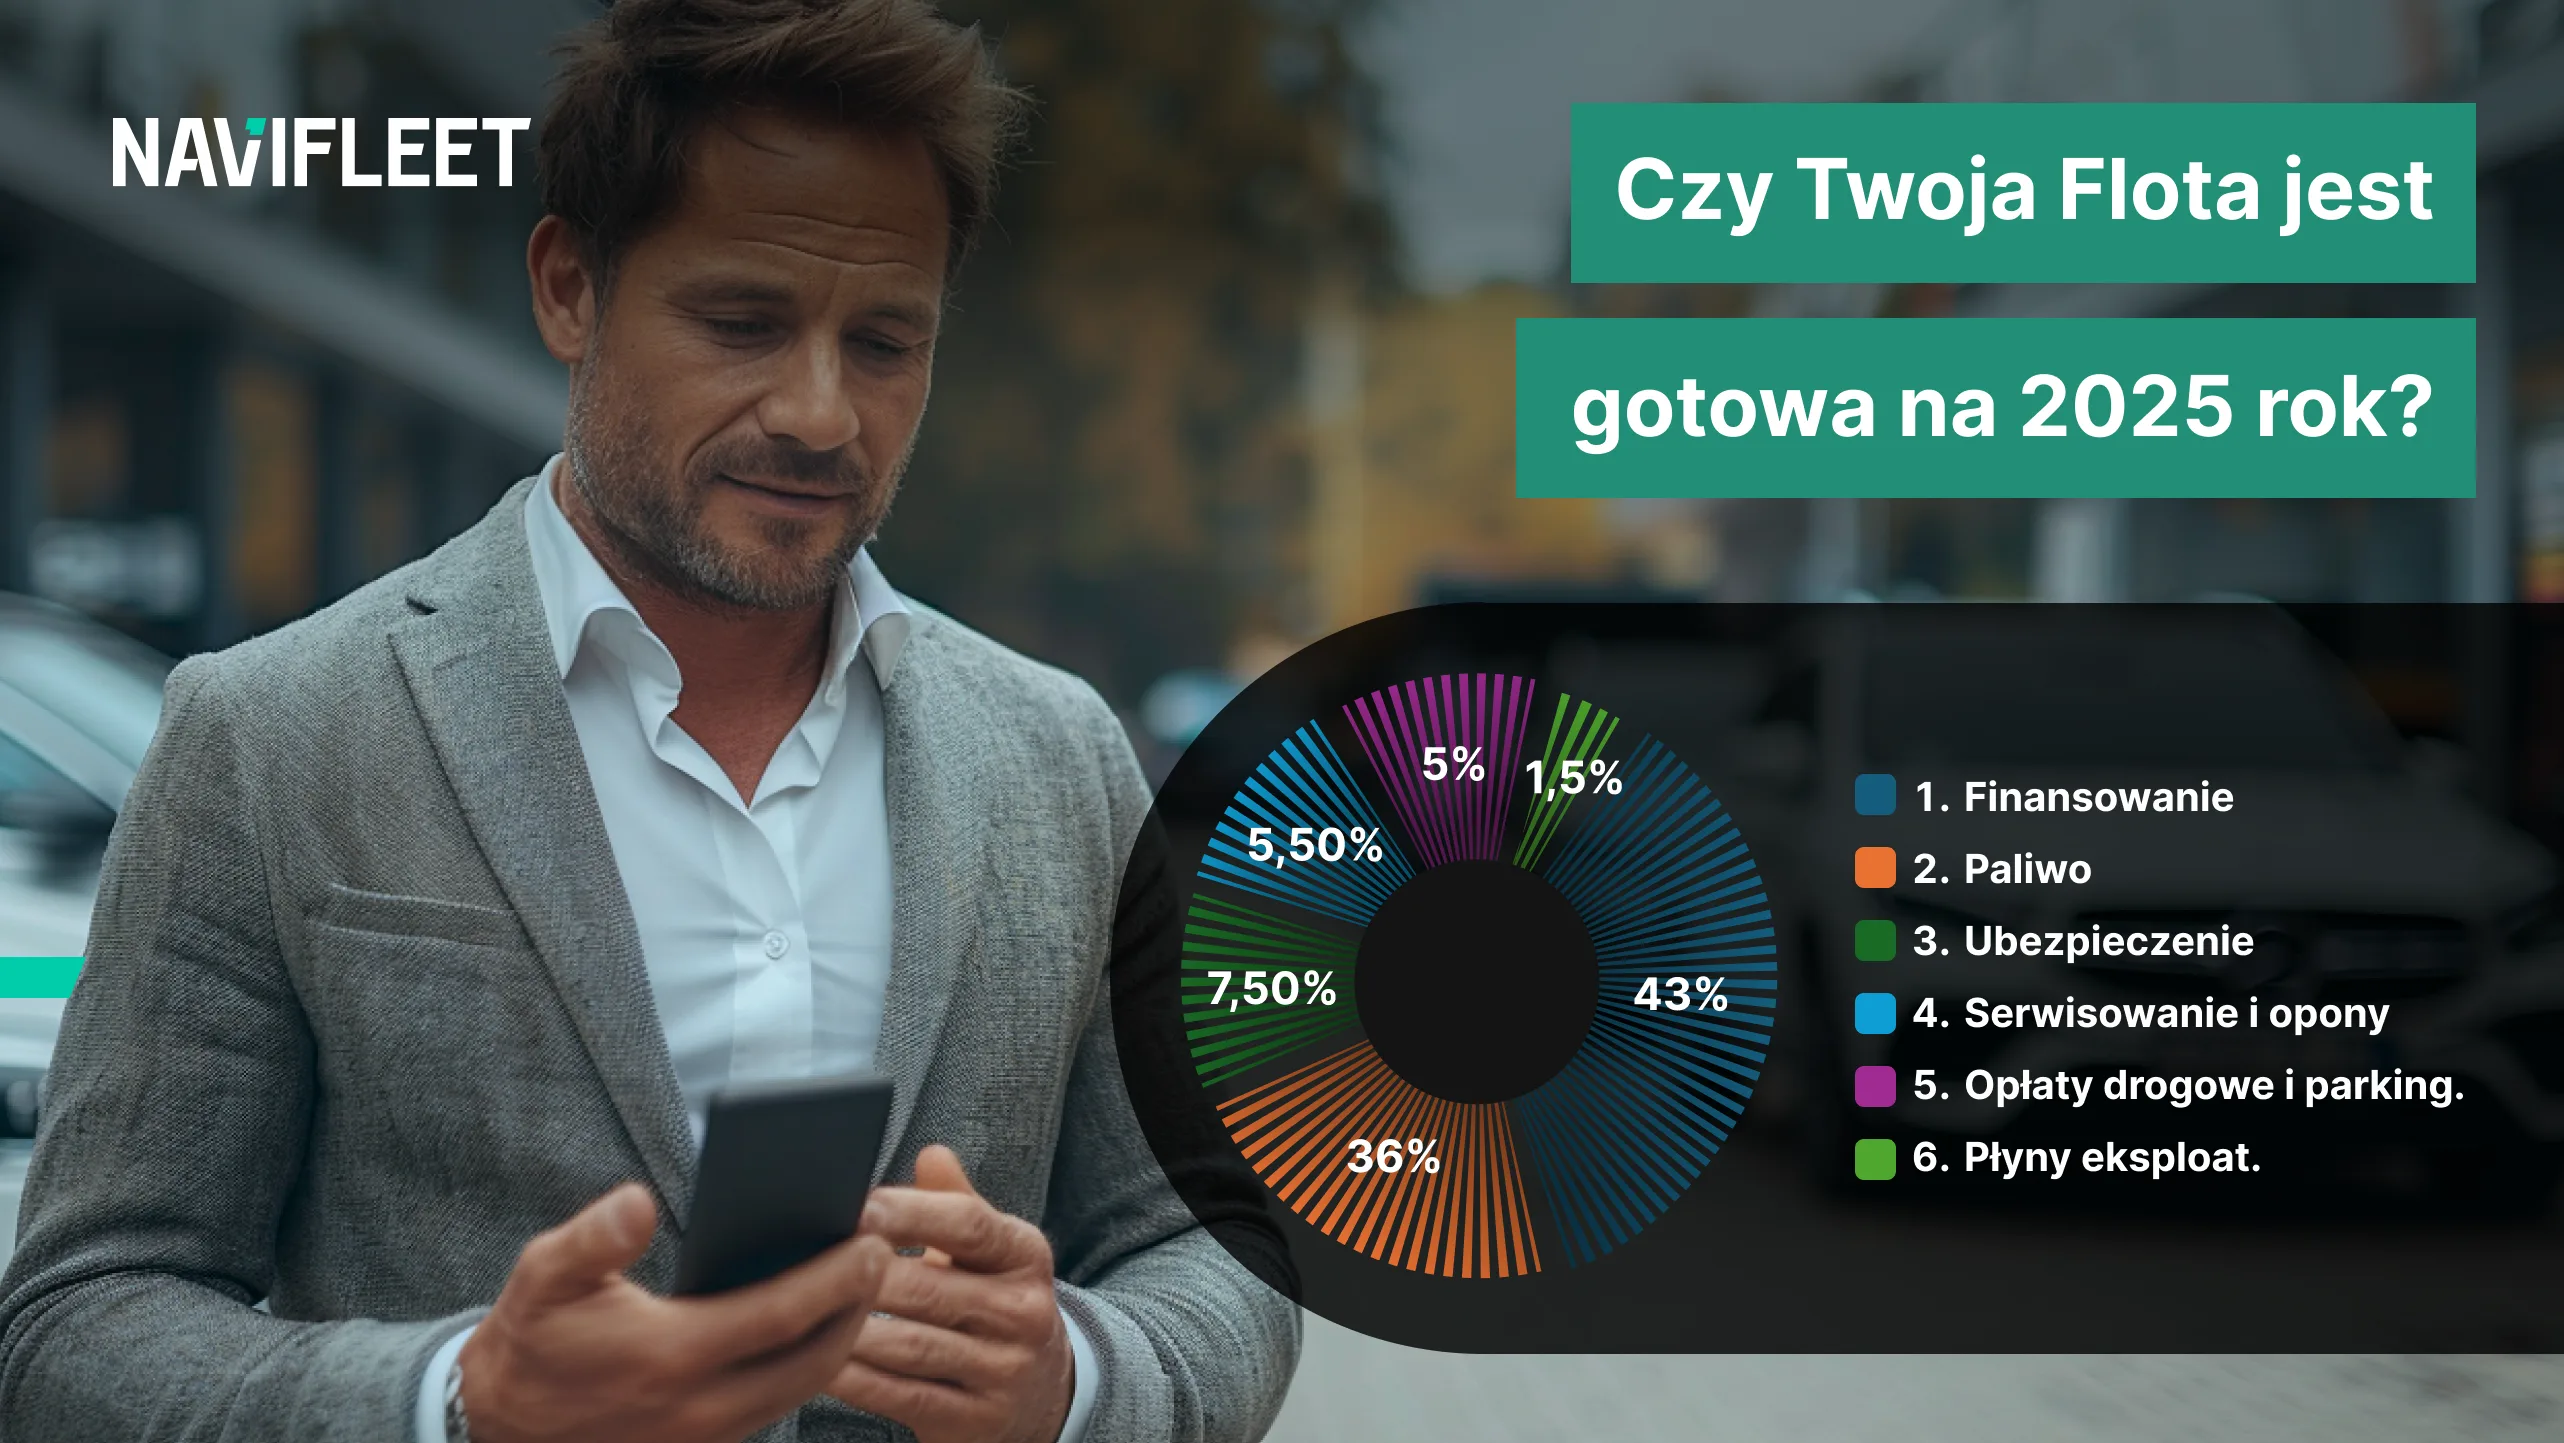
I should stress that this is solely my opinion, and each of you may choose your own, different financing route and the resulting way of monitoring costs. The chart below shows the percentage shares of the largest costs found in fleets.
The most important costs in the passenger car segment are
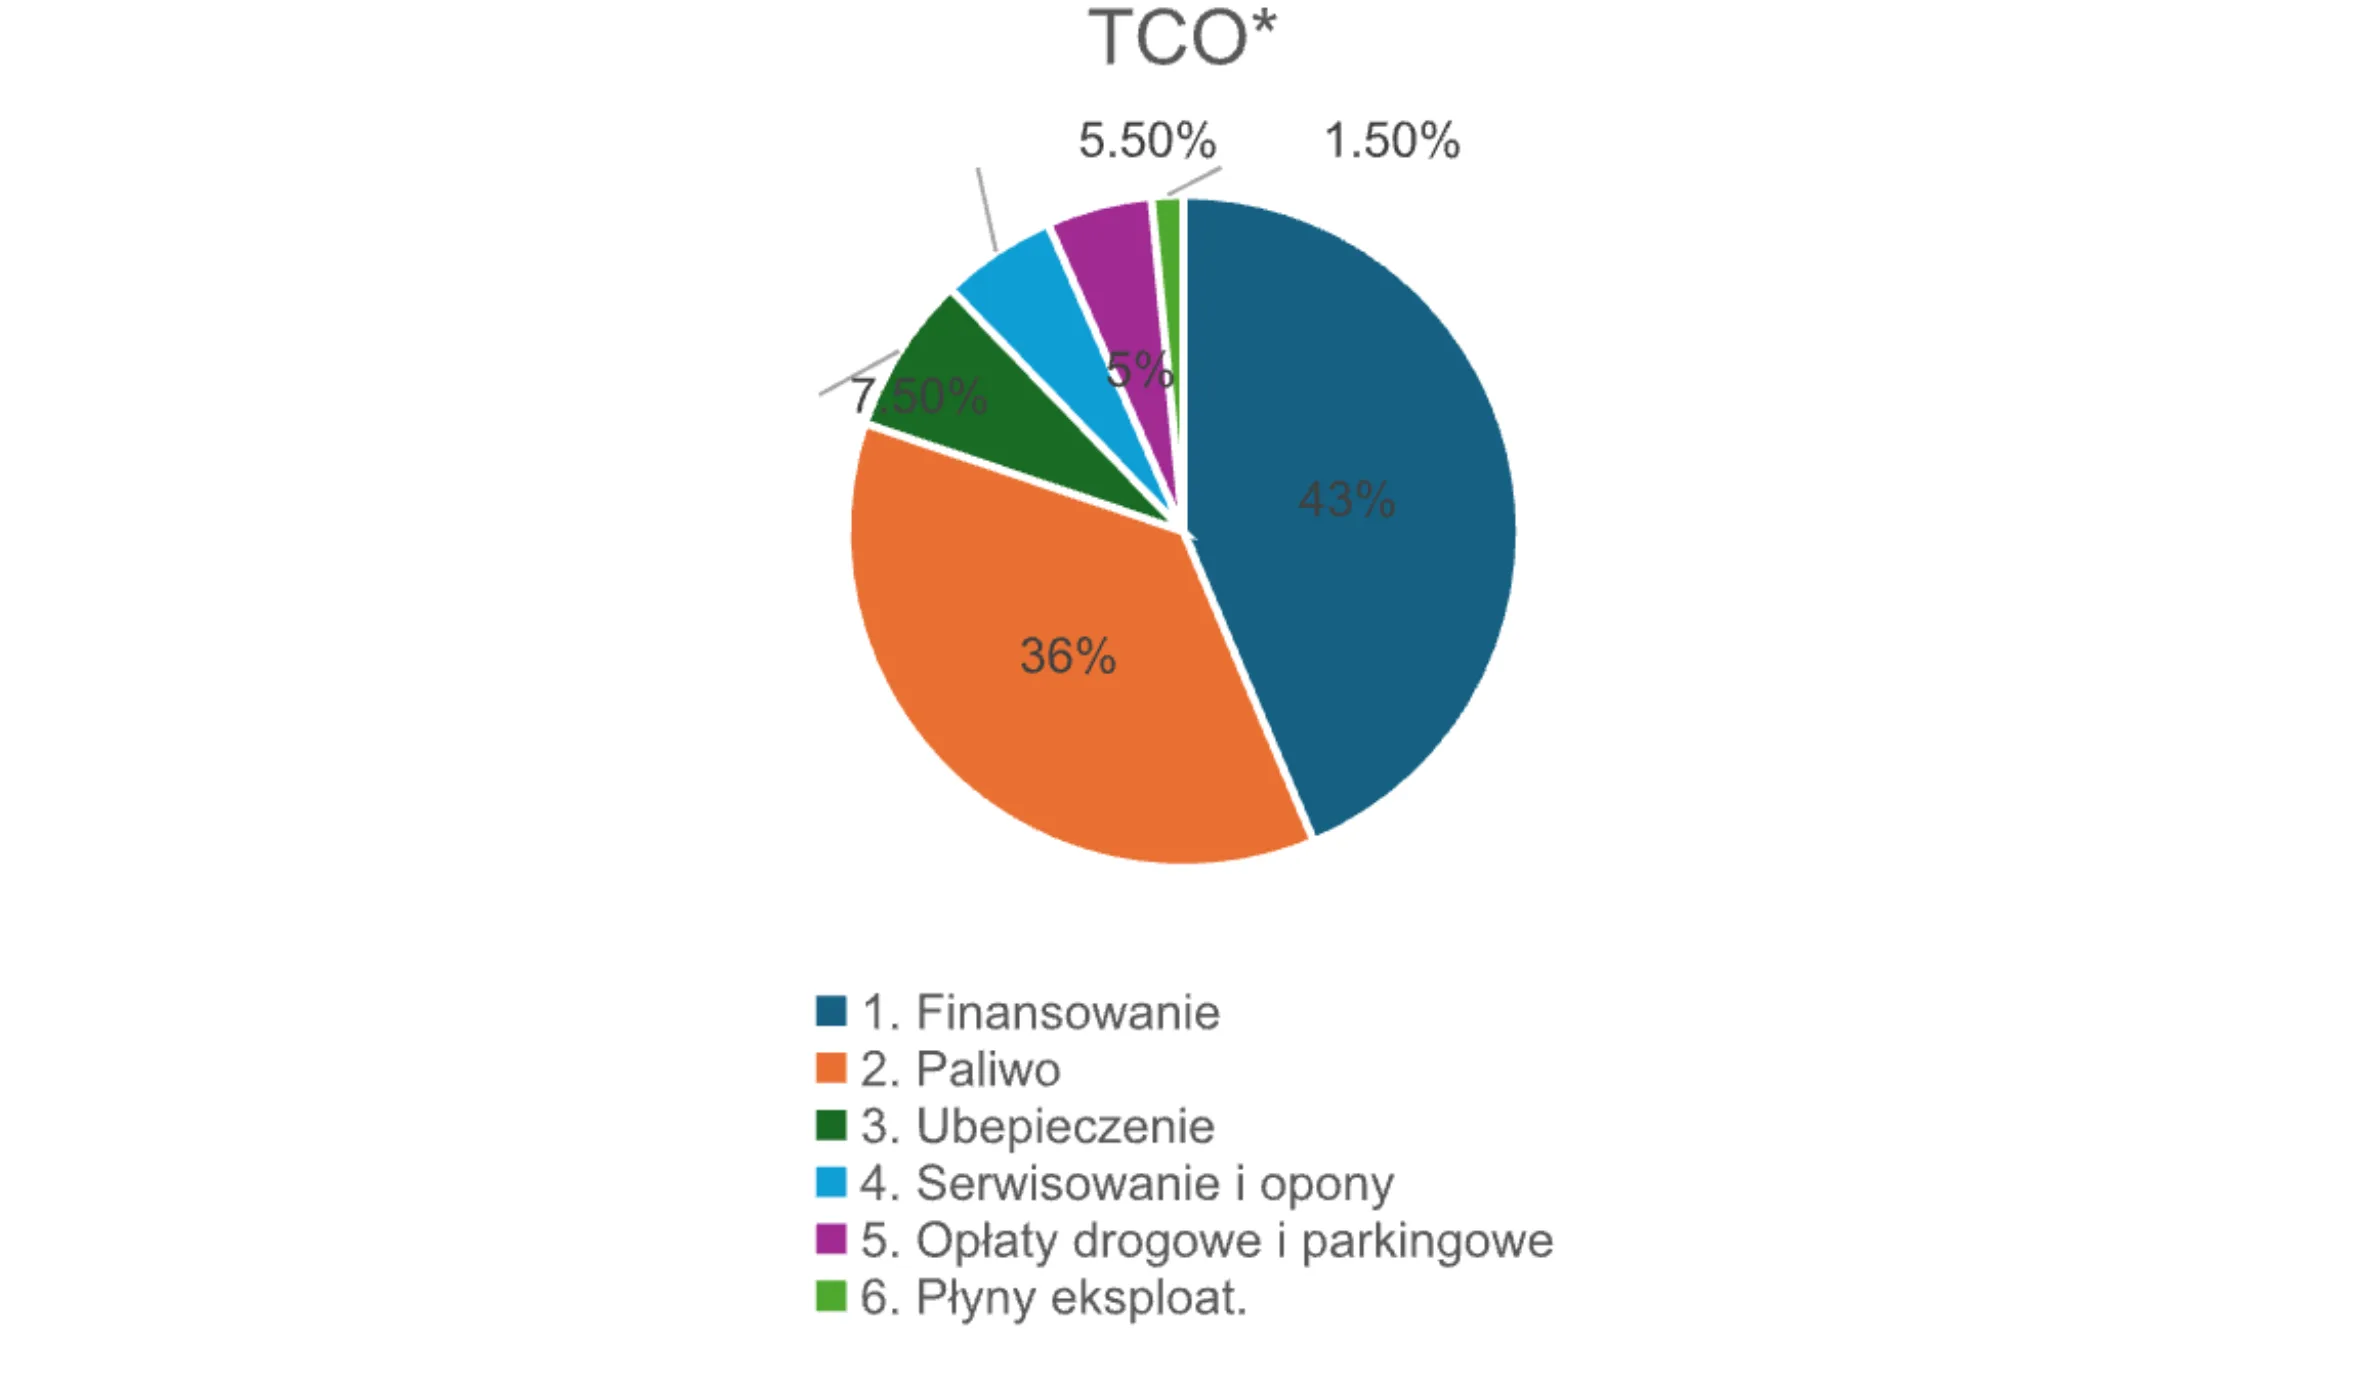
instalment of PLN 1,300 gross, and vehicle insurance totalling PLN 2,700 gross for the whole year.
In my experience with fleets, they are far easier to manage when we reduce as large a part of them as possible to a fixed, predictable monthly amount in PLN. This also lets us budget the annual costs of the whole fleet more accurately, which is of no small importance to company boards.
That is why, in my view, long-term rental is growing in popularity as a form of financing. In this model we have a fixed finance and service instalment that also includes the cost of tyres, and often an insurance instalment. What remains is the variable cost of fuel and other charges (e.g. tolls, parking), which usually make up a small percentage of the total TCO.
So to manage a fleet configured this way we do not need many staff in the department, and cost reporting is also easier, because we really need just one IT system that collects only fuel costs and vehicle mileage. Ideally it should have a cost module and, most importantly for me, an extensive, user-friendly reporting system. The remaining costs will be recorded in the monthly instalment of the long-term rental agreement as a fixed amount for the entire term of the contract. Note that additional costs may still arise during the contract and at its end, such as excessive wear and tear, but this is a subject so broad that, together with the other fundamental provisions of every contract, it deserves a separate article.
How to choose key fleet performance indicators and build a clear dashboard.
The choice of data for analysis and reporting should follow from the needs raised by the main stakeholders of the Fleet Policy. After all, the point is not to analyse all the data and show every piece of information about the vehicle fleet, drivers or costs in charts or tables.
Remember that good practice is to create a clear dashboard consisting of the 3 to 5 most important pieces of information showing the state of our fleet and the Key Fleet Performance Indicators.
Ideally we should also apply a few important rules that go with the transparent art of presenting the collected data, i.e.
- we start with general information and move to ever greater detail
- we add key conclusions to every chart or data table
- we show the data source, time range and units of measurement
- we end with a summary and recommendations for the coming months
An example dashboard could look like this:
I. The level of general information and detailed data
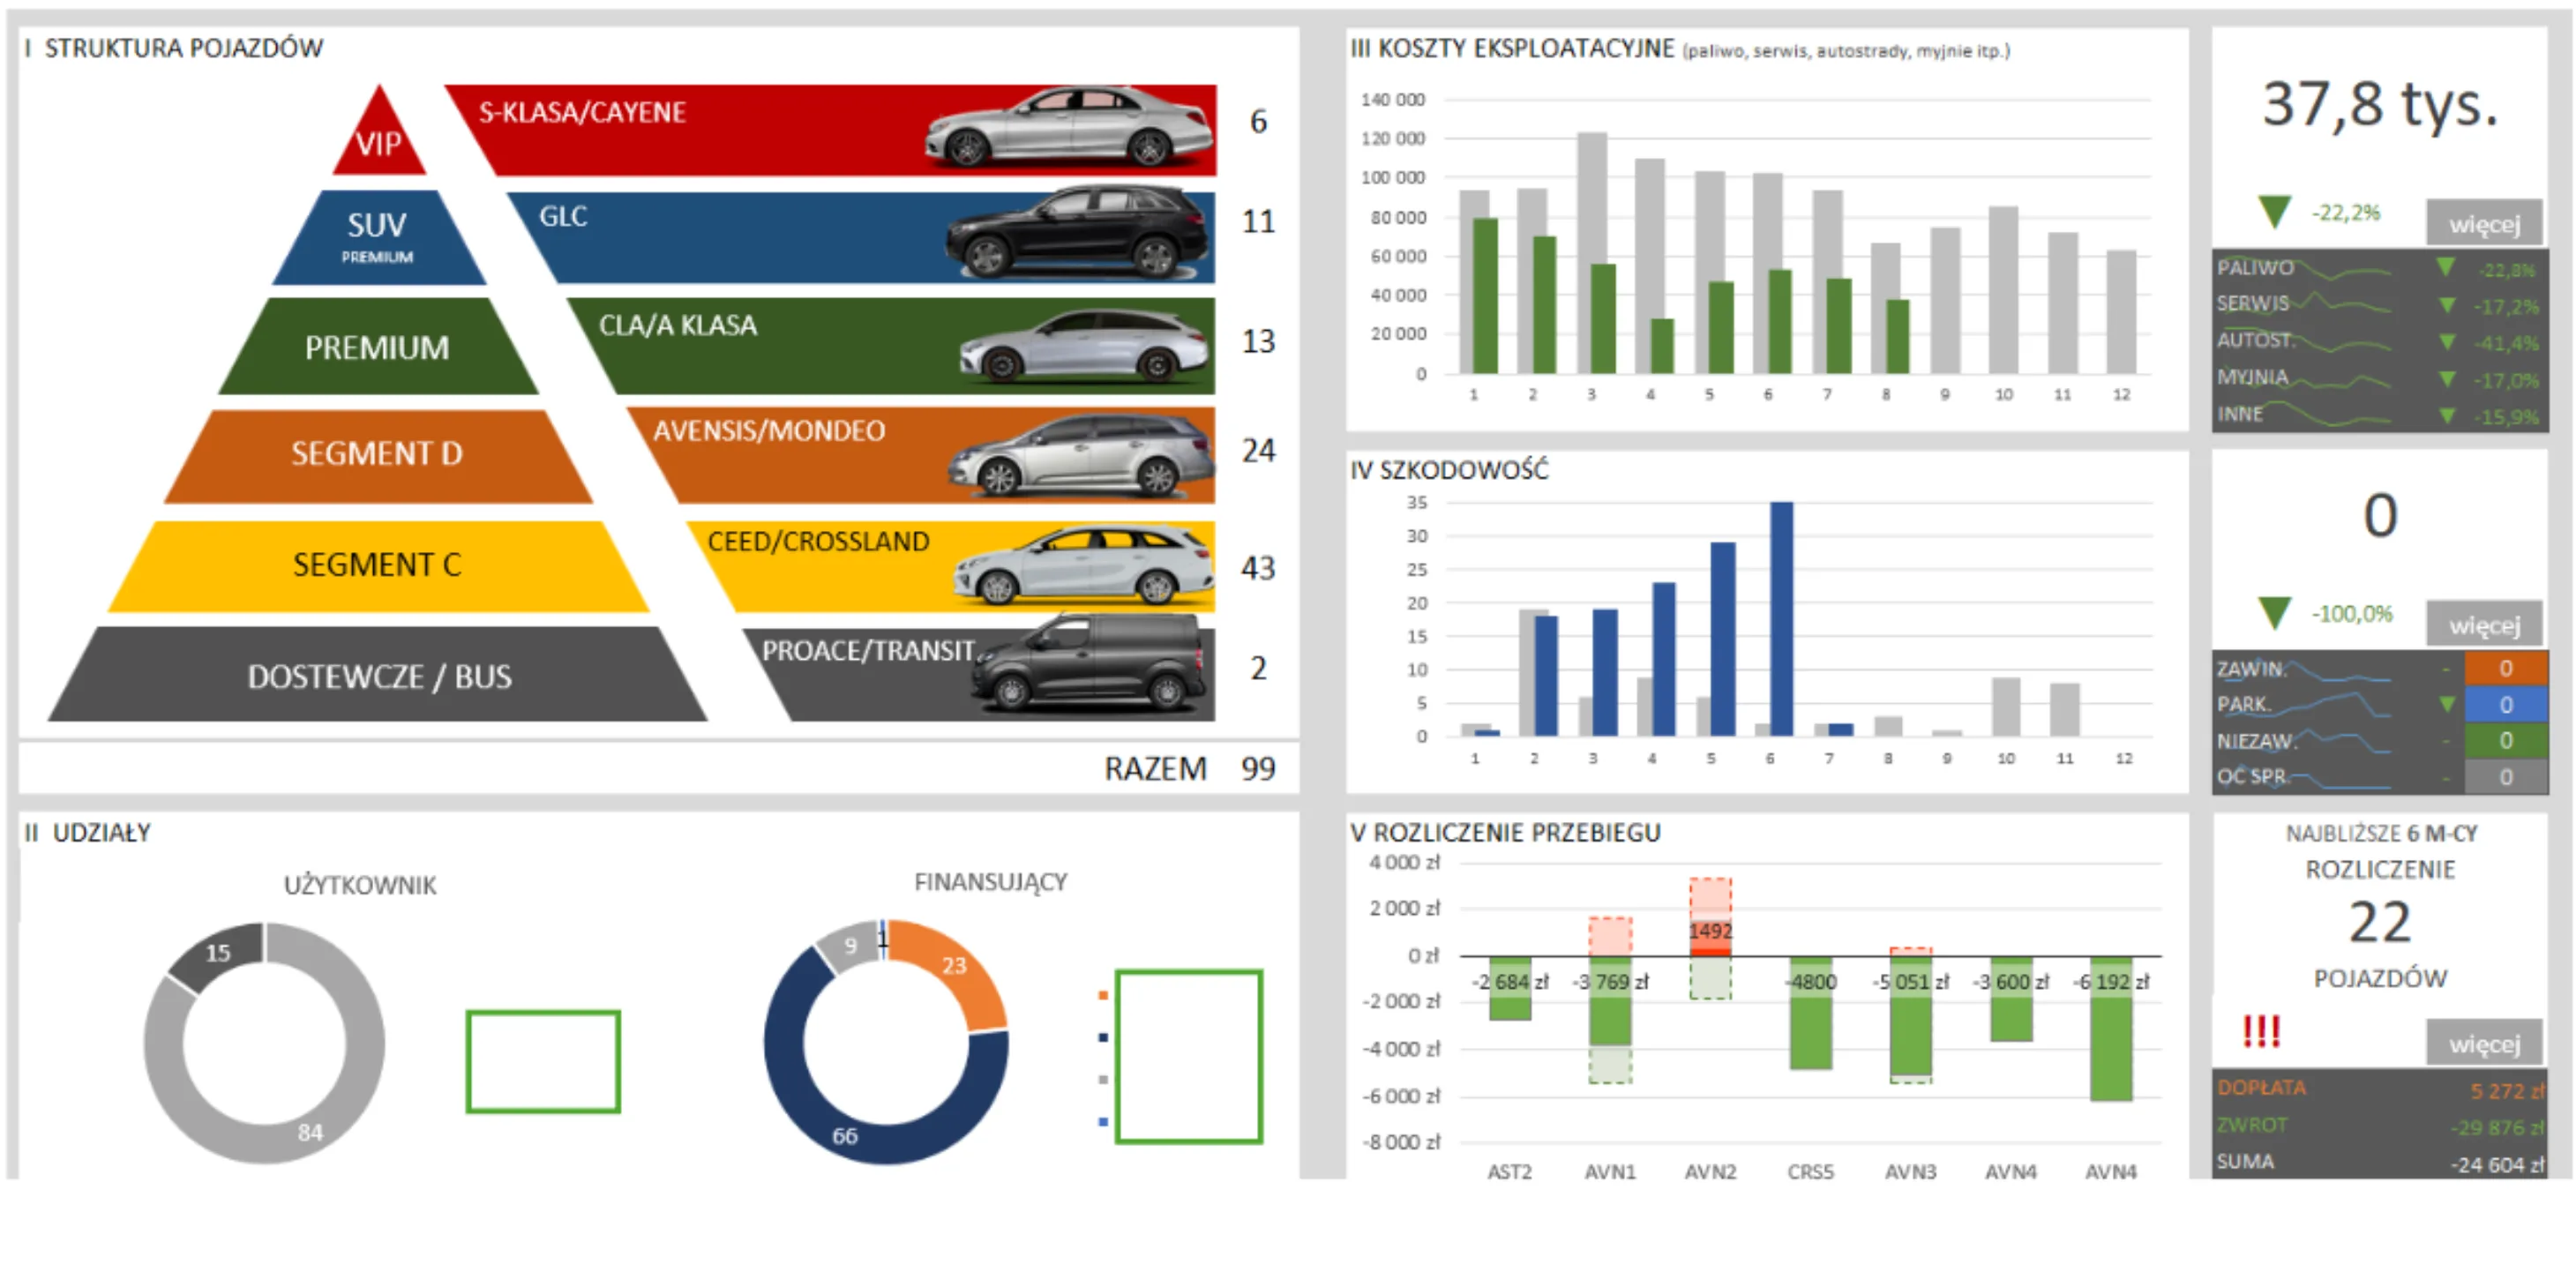
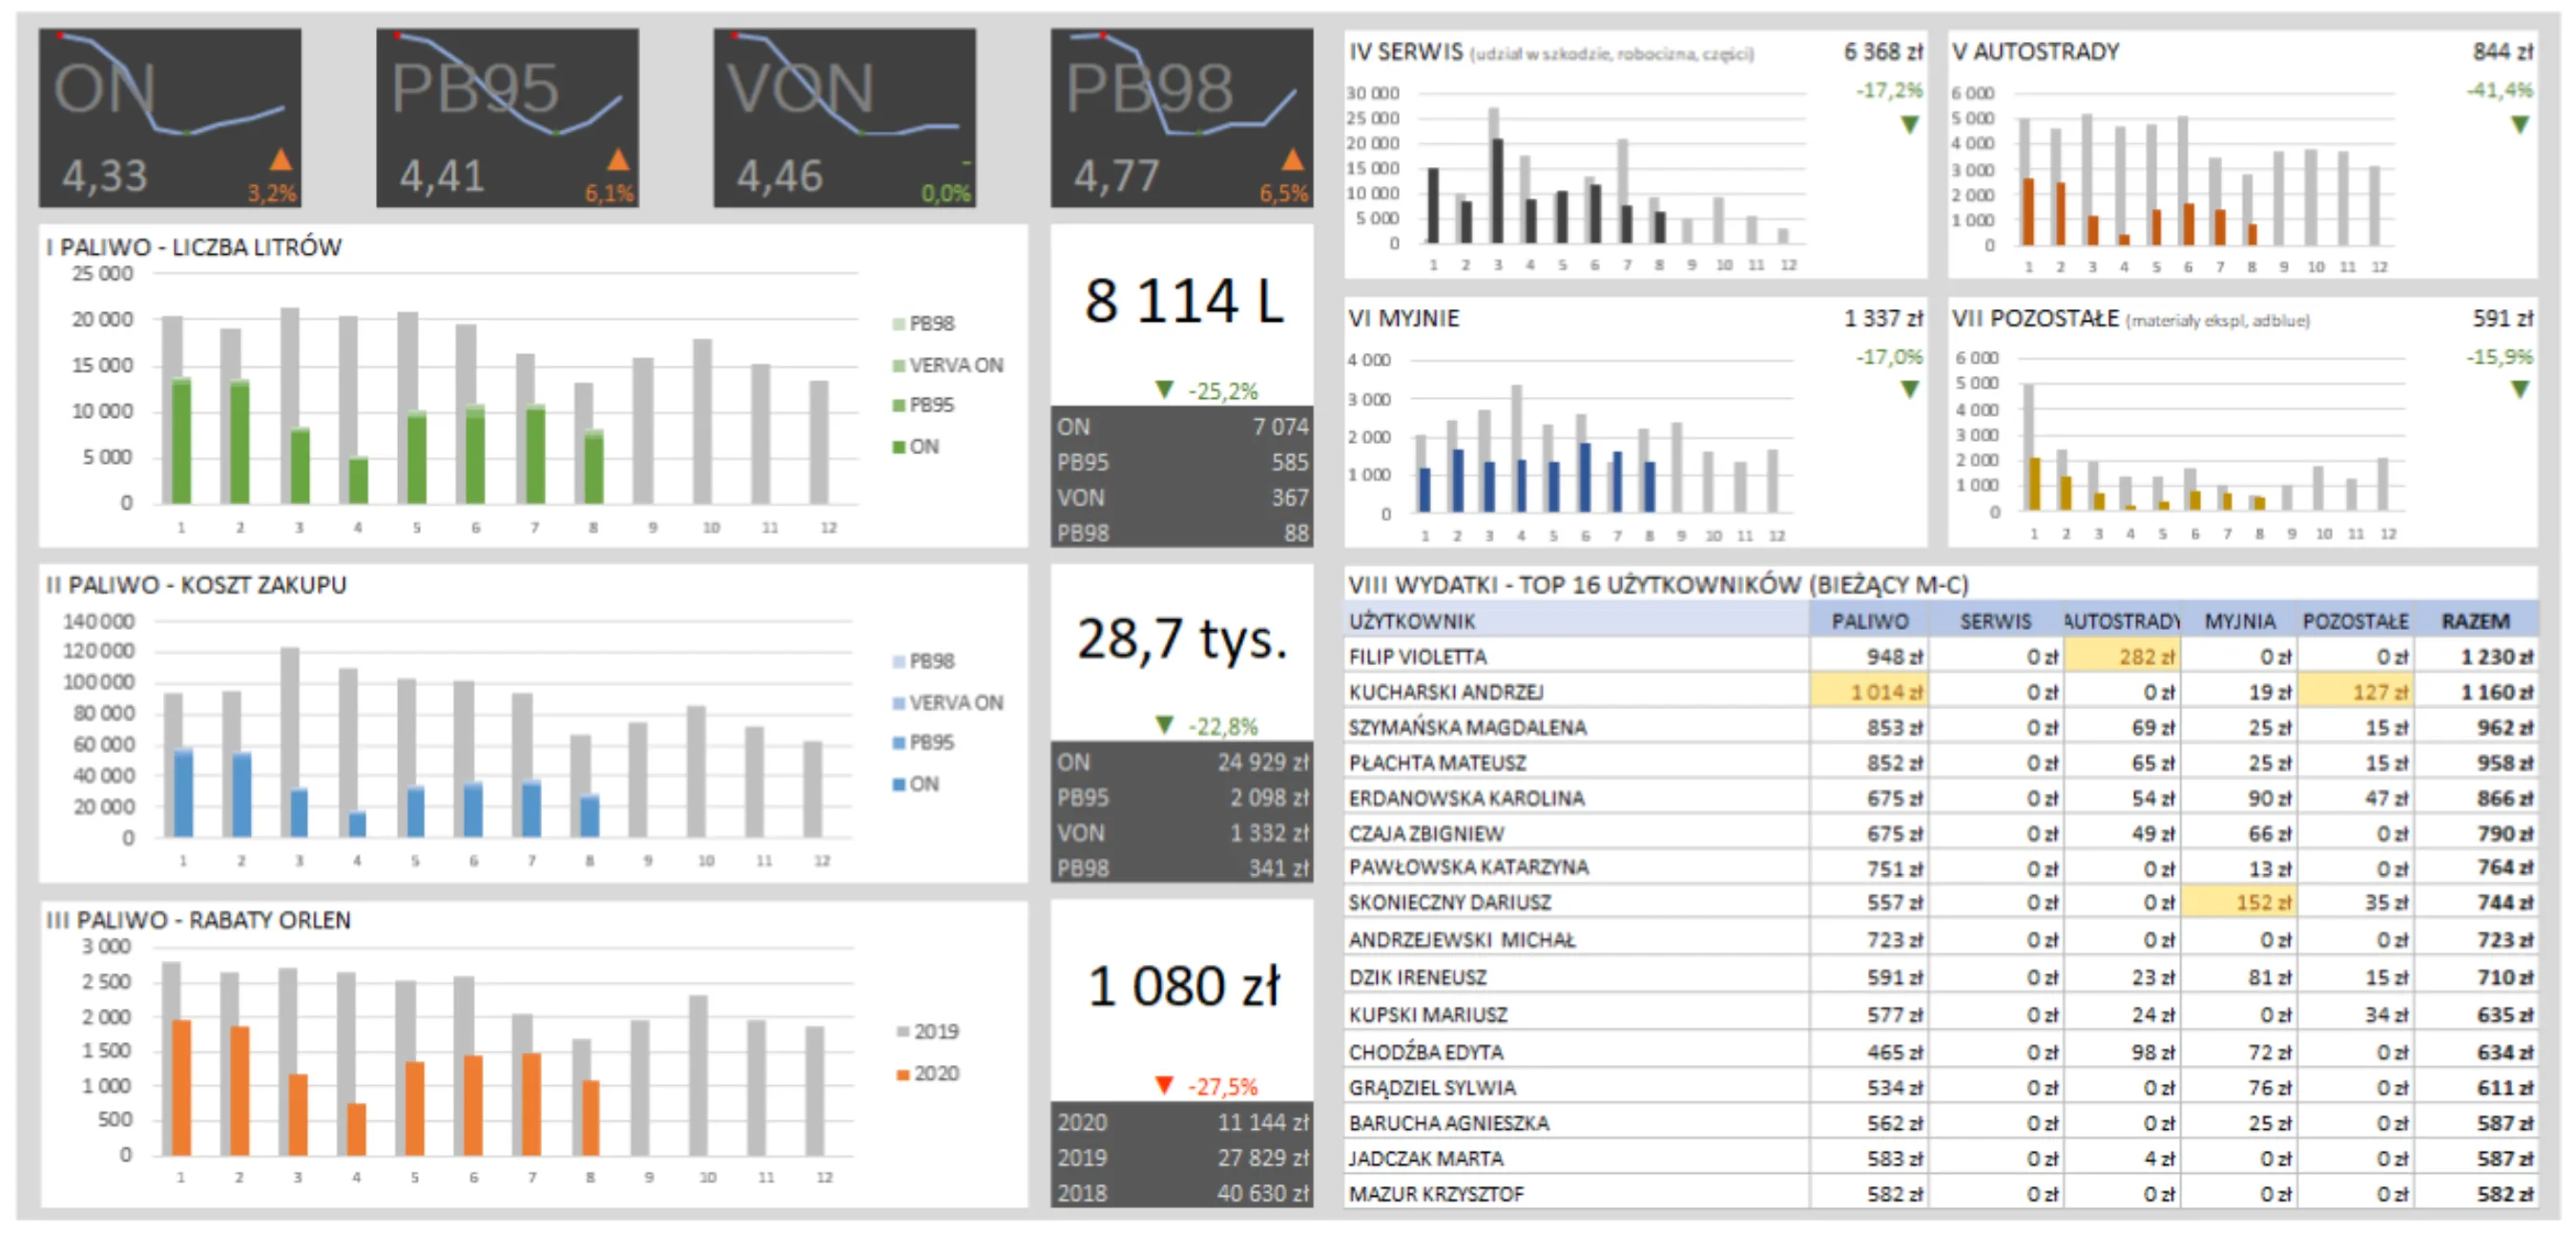
Of course, to create this type of reporting model we ideally need a single, easy-to-use and configurable fleet management system.
When choosing such a system, make sure it has a cost module, a vehicle and user management module, a module for monitoring the accident rate, telematics functions (at least data on current vehicle mileage), and a module for settling long-term rental contracts.
Also important is how easily it can be extended with further functionality, whether you can configure reports and create dashboards yourself, and how simple it is to feed it with data from other IT systems.
Continuous improvement techniques for the fleet management process based on Lean methods and tools
Once we start regularly preparing the reports agreed with our superiors containing key information about our fleet, it is worth considering setting goals that will contribute to the company's main strategies.
Achieving them will involve the fleet manager working consistently on the individual issues relating to the vehicle fleet they manage.
If we have to tackle, say, reducing fuel consumption, lowering the accident rate or cutting TCO, it is worth considering the tools available for day-to-day work on improving results.
As a Lean enthusiast, I recommend using a few ready-made, widely available methods and tools for analysing problems, finding their root cause and, going further, generating ideas.
I particularly recommend:
- the A3 report
- the Ishikawa diagram
- the MSA form
- experimenting in line with the Deming PDCA cycle
The A3 report is a problem-solving and strategic planning tool named after the standard paper size (A3). Its purpose is to present the thought process and problem analysis visually on a single page, which makes it easier to understand and to communicate between team members.
Elements of an A3 report:
- Problem definition
- Analysis of the current situation
- Goals to achieve
- Proposed solutions
- Action plan
- Results and summary
Example use: A fleet manager identifies a problem with rising fuel consumption in the company. In the A3 report they describe how the situation has changed, analyse the causes (e.g. employees' poor driving technique), set goals (a 10% reduction in consumption) and propose actions such as eco-driving training for drivers.
The Ishikawa diagram is a cause-and-effect analysis tool that helps identify and visualise the potential sources of a problem. Its structure resembles a fish skeleton, where the head is the problem and the "bones" represent categories of causes, such as: people, machines, methods, materials, environment, management.
Example use: If a fleet has a problem with frequent vehicle breakdowns, the Ishikawa diagram can help the fleet manager identify the causes. They may consider categories such as:
- People: lack of driver training,
- Machines: inadequate maintenance,
- Methods: an ineffective servicing policy,
- Materials: use of cheap, low-quality parts.
The MSA form is used to analyse the measurement system to make sure the data collected is reliable and accurate. This makes it possible to confirm that the measurement methods and tools are stable and suitable for evaluating processes.
Example use: If the company monitors mileage and fuel consumption using a telematics system, MSA will help check whether the data collected by that system matches reality. The analysis may show that the devices in some vehicles need calibrating, which will improve the accuracy of reporting.
Experimenting in line with the Deming PDCA cycle. PDCA (Plan-Do-Check-Act) is a cyclical method for improving processes and solving problems. Each cycle consists of four steps:
- Plan: Identify the problem and develop a plan to solve it.
- Do: Implement the plan on a small scale.
- Check: Analyse the results and verify the effectiveness of the solution.
- Act: Refine the solution and roll it out on a large scale if the test was
successful.
Example use: A fleet manager wants to reduce vehicle servicing costs by introducing a new preventive maintenance schedule.
- Plan: Develop the new schedule and a plan for introducing it.
- Do: Run a pilot on a small group of vehicles.
- Check: Monitor the effects in the form of a drop in the number of breakdowns.
- Act: If the results are positive, roll the schedule out to the whole fleet and keep improving the process.
Using these tools allows a better understanding of problems and the implementation of effective actions, which is key to effective fleet management.
Summary
Managing a vehicle fleet in the face of a dynamically changing market and growing financial and environmental demands requires fleet managers to take a comprehensive approach and use modern analytical tools. The 2024 Fleet Barometer survey shows that companies in Poland are actively looking for ways to optimise costs, increase efficiency and adapt to new trends such as alternative drivetrains and long-term rental. What may be underestimated among managers is the effective use of Lean techniques and tools, such as the A3 report, the Ishikawa diagram, MSA and the PDCA cycle, which help analyse problems accurately and implement effective solutions.
In this article we discussed how using performance indicators and clear dashboards can support fleet decisions, and how continuous improvement of management processes contributes to long-term benefits.
With the right approach it is possible not only to monitor costs better, but also to introduce measures that raise operational efficiency and employee satisfaction. I invite you to follow further posts on our blog, where we will delve into more detailed analyses, share examples from practice and present innovative solutions for fleet managers.
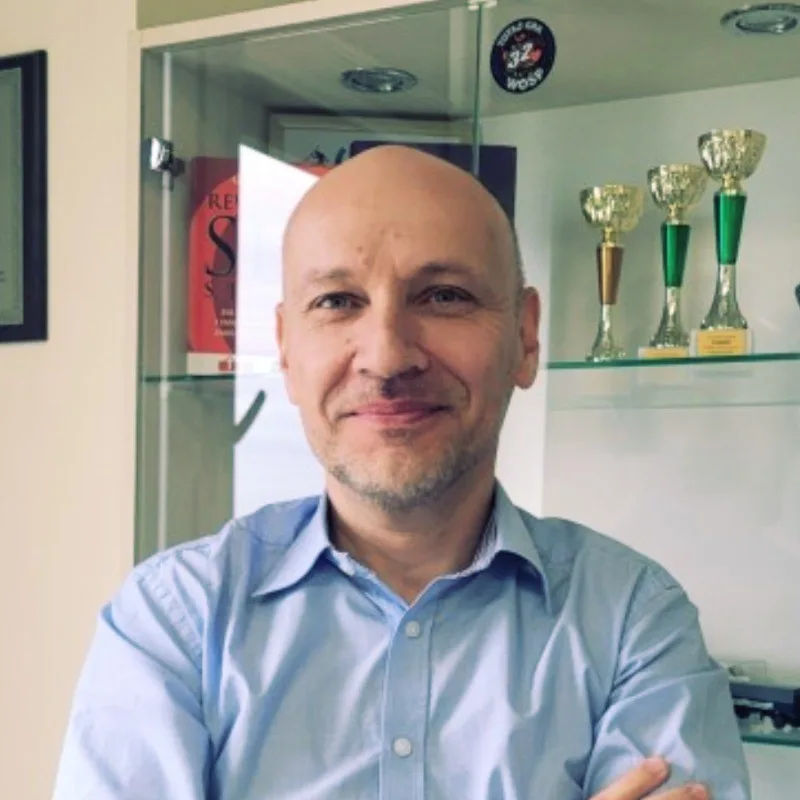 Piotr Litwin
Head of Logistics & Lean Coordinator at OCEANIC
For more than 20 years he has combined logistics management with fleet operations. He started with truck fleets of over 100 vehicles delivering food products, and in later years successfully led the transition from owned fleets to fleets managed under long-term leases.